Reports
Reports built out of what your crews actually recorded
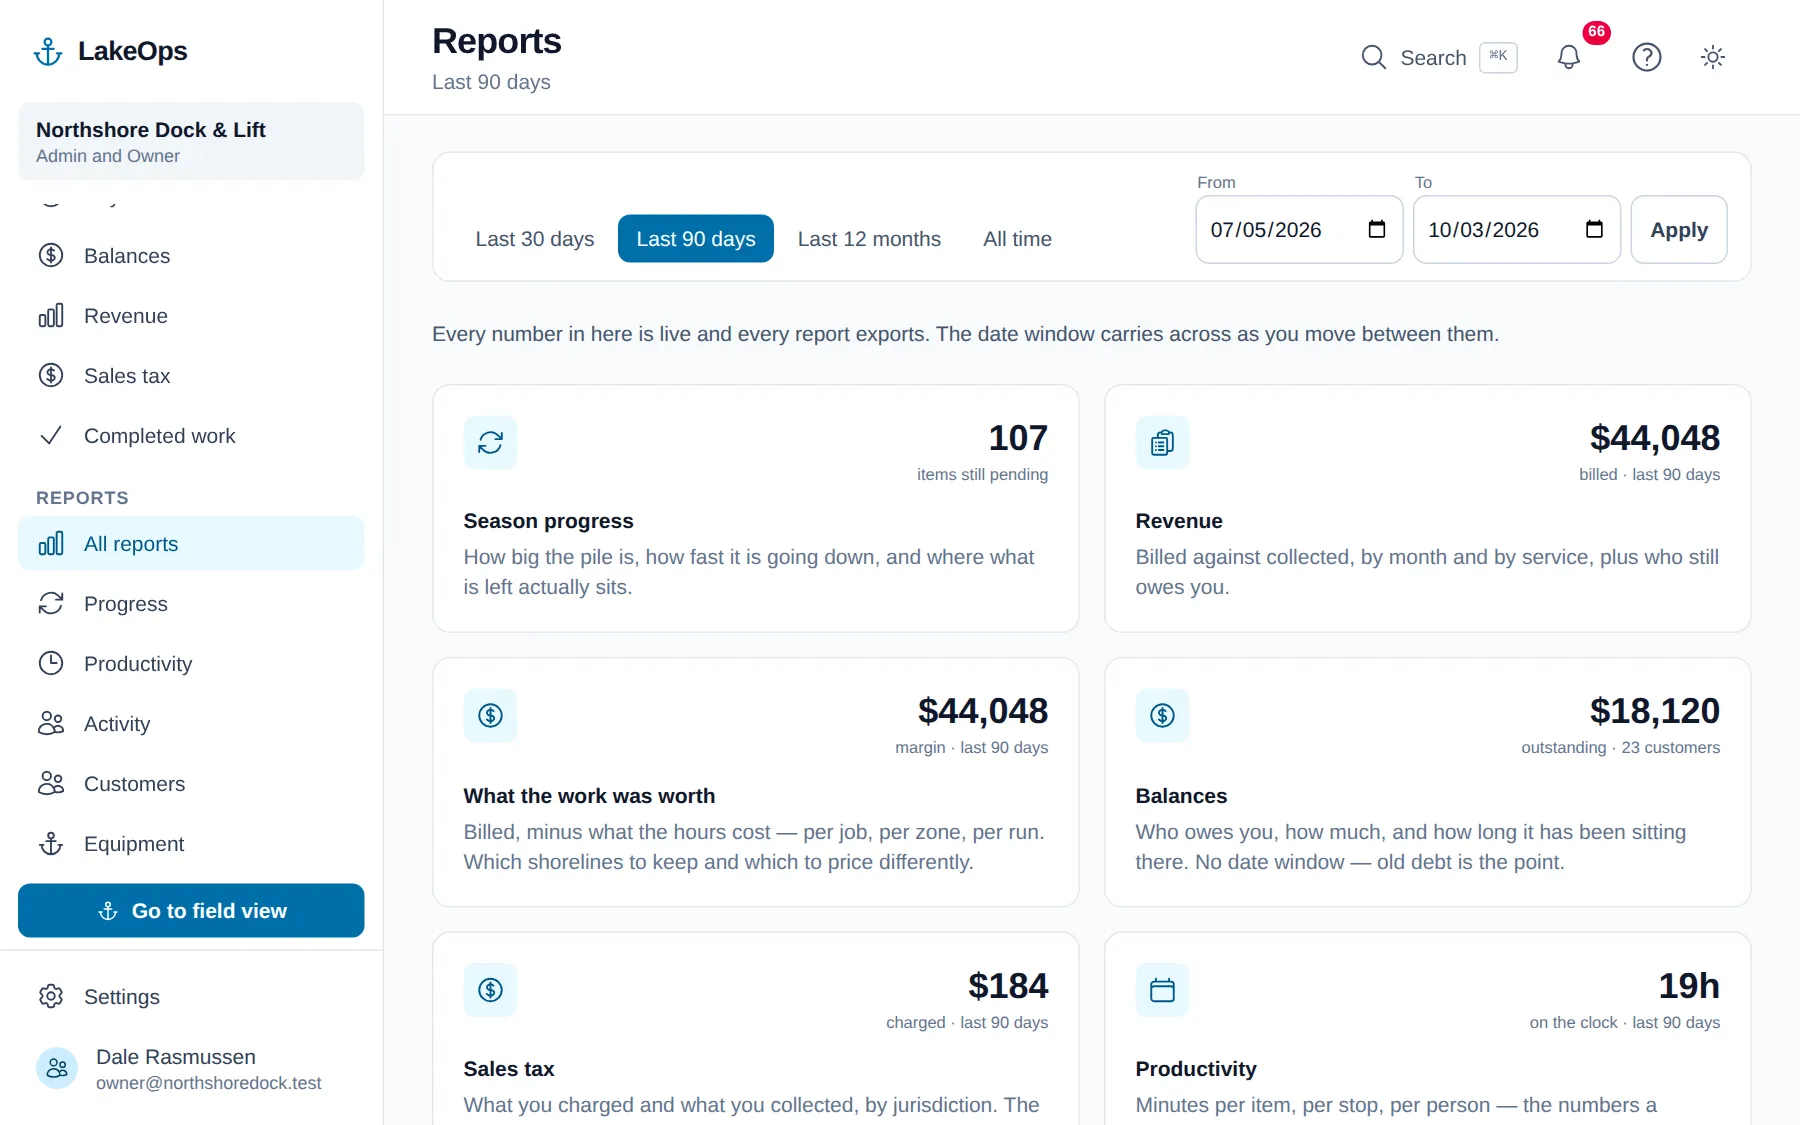
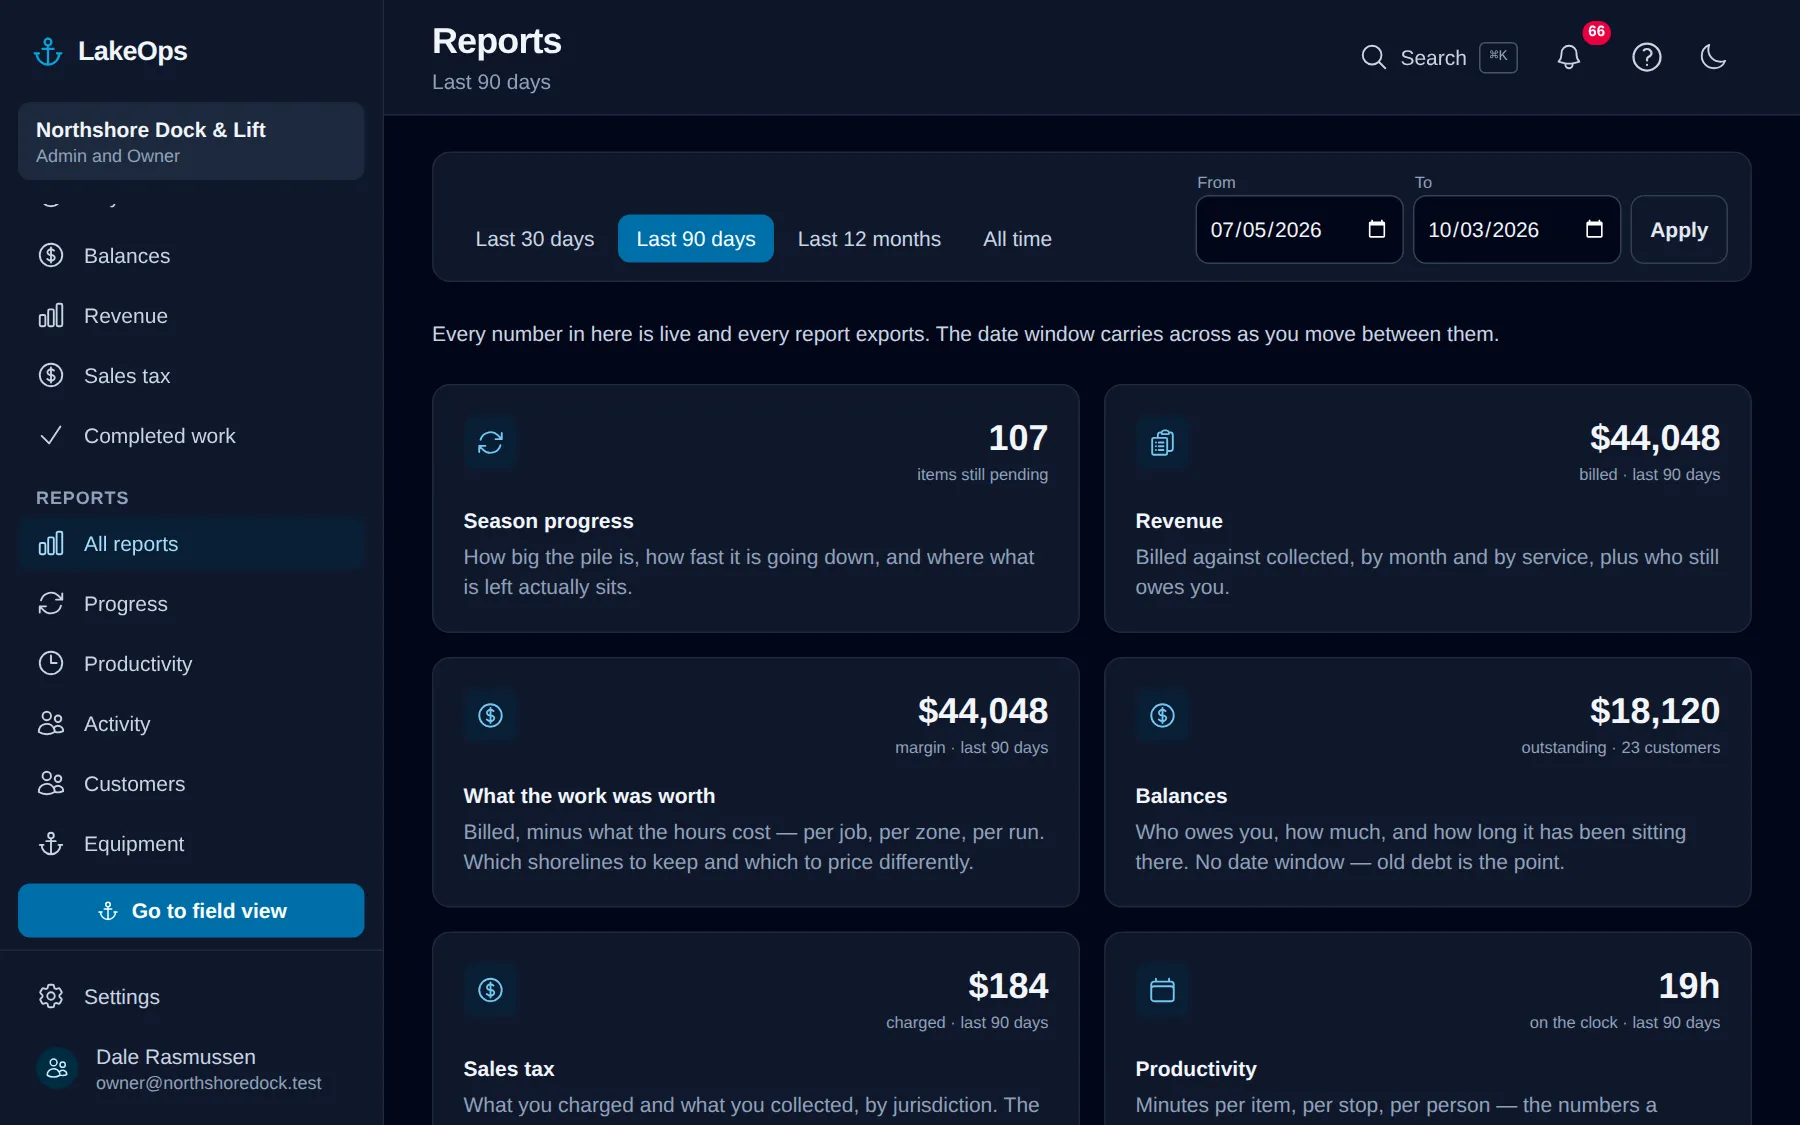
LakeOps includes a report for each question a season asks — season progress, revenue, what the work was worth, balances, sales tax, productivity, activity, customers, equipment and completed work — and every one of them exports to CSV. None of them is a dashboard of numbers nobody asked for. Each one exists because you ask that question yourself, usually in May, usually before six.
“Are we going to get everybody in before the Fourth?”
The progress report shows how much was there at the start, how fast it’s coming down, and where what’s left actually sits. The line to watch is the one showing what was still open at the end of each week. Flat means you’re treading water, and you’d rather find that out in the first week of June than the last.
- What’s left over time, and how much got finished each week
- What’s left by zone, so you know where the second boat should go
- What’s left by the gear it needs — the number that decides whether the crane goes out
- The properties that have been waiting longest, because nobody plans to forget one
“What does an hour of this actually cost me?”
Minutes per piece, minutes per stop, pieces per hour, by week and by person. Every figure came off a clock a crew member started on the water, not out of a timesheet somebody filled in on Friday. It’s the number your whole price list should be built on, and almost no shop in this trade has it.
- Minutes per piece — the number a season gets priced from
- Where the day actually goes: the properties at the top are hard to reach or priced wrong
- By person and by service, so you can see what a new crew member is costing you while they learn
- Install against removal, side by side, which is a conversation most shops need to have
“Which shorelines are actually worth working?”
Every other report answers how much, or how long. This one subtracts: what each completed job billed, minus what the hours it took actually cost you. Enter an operator hourly cost and a deck hourly cost once, and the clocks your crews already ran do the rest.
- Margin per job, sitting next to what the job billed
- By zone — a bay forty minutes from the landing does not look expensive on any other screen
- By run: one boat, one day, one crew. Two crews on the same lake can differ by half.
- The jobs that barely paid, worst first — each one is either priced wrong or slower than anybody realised
- Three crew for two hours is six hours of labor and two hours of boat, counted separately, because there is one barge and it was tied up once
- It never guesses. No hourly costs entered means every figure reads zero and the page says so.
“Who owes me money?”
The balances report is every unpaid job, aged from the day the crew finished it, oldest money first. When it’s time to put the whole position in front of a customer, a statement is one page of everything they owe — and if you take payments through LakeOps, one link that pays the lot.
- Aged 0–30, 31–60, 61–90 and over 90 days, from the day the work was done
- A statement on one page, sent when you decide to send it
- Reminders and a late fee are there when you want them — off until you switch them on
- A payment lands and the balance moves, whether it came by card, bank, cash or check
“Who’s gone quiet?”
The customer report finds customers whose equipment is still in the lake with no service plan for next season. That list is money, and nothing else in your business surfaces it — you find those out one at a time, in April, when somebody doesn’t call.
- Customers with equipment on the shoreline and nothing arranged for next year
- Your best customers by what they were actually billed, not by how it feels
- How many of your properties are on a service plan and how many aren’t
- What’s on the water across every customer you serve, by type of equipment
Nothing’s trapped in here
Every report gives you a CSV of exactly the rows on the screen. The completed-work report also prints, because that’s the one an accountant asks for. The same date window carries from report to report, so the numbers keep meaning the same thing when you move between them.
- Every report exports to CSV
- The completed-work report prints, one row per piece
- The activity report is the trail: who did what, and when
- The equipment report shows what the open work is asking of your fleet
Questions about this
- Can I get my data out?
- Yes. Every report exports to CSV and the completed-work report prints, and there is nothing in LakeOps built to make leaving difficult.
- Do the reports work on a phone?
- Yes. They’re built to read on a phone and they’ll load on a bad connection, and they print properly when you need them on paper.
Put your own shoreline on the screen
Create the account yourself, import your customer list, drop a few pins, and you’re looking at your own water this afternoon. No sales call, no setup fee, and nothing charged until your first season generates work.
No card, no sales call, nothing to book — you're in within a minute. Send us a question if you'd rather ask a person first.